Statistic Views
Starting with Swisslog Version 5 a great number of Statistics with the corresponding information tables are predefined. The Statistics are called the Standard Statistics and are stored in the database SWLSTAT.MDB. You can not update this database; it will be replaced when updates for information tables or new statistics are available.
SWLSTAT.MDB also contains some standard Statistic Report Templates. As with the Statistics, you can add your private templates which are stored in your Log database.
By default all statistics are active. Active means that each time you enter a new QSO all Statistics are checked to see if the QSO qualifies for the Statistic. It's obvious that this needs some CPU processing time; therefore you can deactivate Statistics in which your not interested.
Because only a limited number of fields are available to store Statistic information Variable Statistics are used if a field conflict would exist. Field conflicts are detected at run time. If you define Private Statistics you will get an error message when entering a QSO. You then have to inactivate one of the conflicting Statistics, use another field or use a Variable Statistic. A function is provided to re-assign a new field for a statistic, see resolve statistic conflicts.
SWISSLOG provides 3 different Views to display Statistic Information.
The Statistic (View): displays all information of a Statistic in a window
The Statistic-Quick-View: displays the Statistic Information only relative to the currently selected QSO in a small Window. The information is dynamically updated each time the selected QSO changes.
The Statistic-Quick_Info: displays the following Information for the currently selected QSO:
the DXCC Information
a summary for selected Statistics
optionally a list of previous QSOs with the current station
To open a Statistic-View select one of the Statistic-View entries in the View menu:
Statistic
Statistic-Quick-View
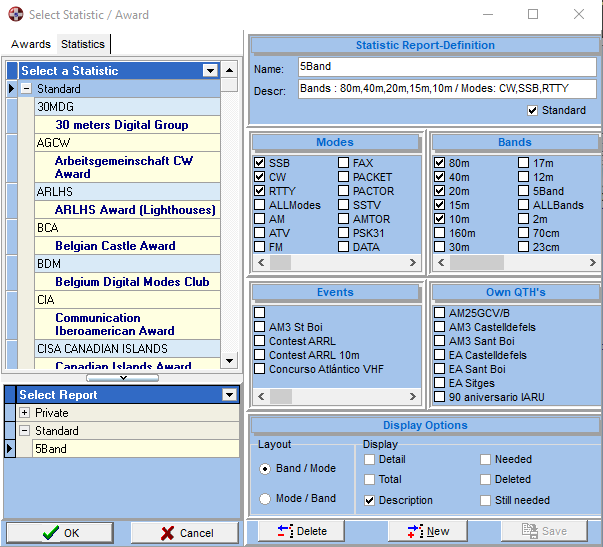
This opens the Statistic-View Selection dialog in which you can select the Statistic(s) to be displayed and the Statistic-Report-Definition to be used for the Display. Statistic-Report-Definitions define the details of what should be displayed like Bands, Modes or the QSOs which should be included based on Events or own QTHs.

The Statistic Selection Dialog has two parts:
The left side is used to select the Statistic and a Report Definition. Select an Award or a Statistic and a Report.
The right side displays the properties of the selected Report and allows you to add new Report Definition or to modify existing ones. You can also temporarily modify an existing Report Definition; just do not press the save button. See Statistic-Report Template for details.
This is a Tree View with the main nodes (sections) Private Statistics and Standard Statistics. To select a Statistic View either select a Statistic from the Private or Standard Statistic section and then a Report Template from the list of reports which is displayed when a Statistic is selected.
To open or close a section press on the + or - signs.
See Create a Statistic-Report Template for details.
You can deactivate Statistics you are not interested in. This will improve the performance when entering QSOs. SWISSLOG checks for which of the active statistics the QSO qualifies and sets the field names to the Prompt and links the Information table to the field as defined in the statistic definition. Deactivating a statistic excludes it from this process and therefore makes QSO entry faster.
To deactivate a Statistic select
Options ¦ Active Statistics
and remove the check marks for the Statistics to be deactivated in the following dialog
Be careful! Some unexpected things can happen after deactivating certain statistics. For example: if you deactivate the WAS and US_COUNTIES statistics then the US state and US county Information Tables will not be assigned automatically to the Region and Sub-Region fields. You will notice this when the Region field's name won't change to "State", and the Sub-Region field's name won't change to "County". Example:
So if you disable those 2 statistic and you log a US station you will no longer be disable to select the county from the list - you will get the error message shown above - and you will have to find and type the name yourself!
The Statistic View displays the selected statistic in a split screen window. Pressing the right mouse button will display a pop-up menu which provides a few additional statistic functions. The Statistic Views can include all QSOs of the Database or only QSOs made from specific QTHs.
To display the Statistic View press Ctrl-S or select
View | Statistic from SWISSLOG's main menu.
This displays the Statistic Selection Dialog.
Select the Statistic you want to display
Select the Report-Template
press OK
The Statistic is now displayed
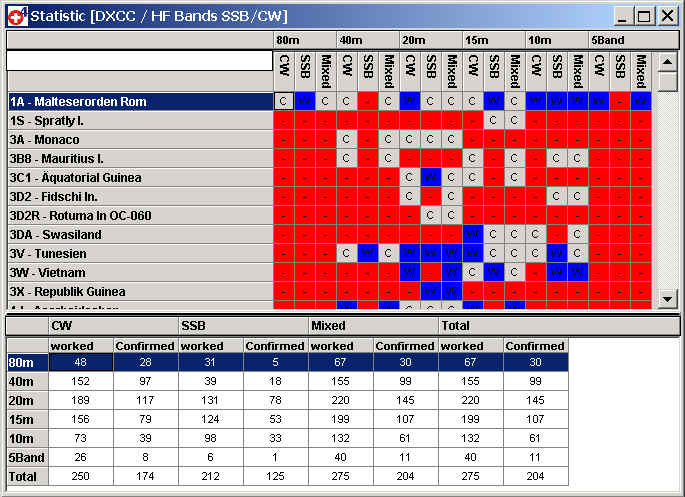
The following functions are available in the Statistic View
Display the QSOs belonging to a Statistic Cell
You can display all QSOs which belong to a Statistic Cell by double clicking on it. This is handy for selecting QSO for Awards.
Pop-up Menu. Press the right mouse button to display the pop-up menu:
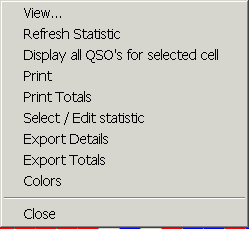
View displays a dialog which allows you to temporarily change the template properties.
Refresh Statistic recalculates the Statistic. Use this if you have added or changed QSOs while the Statistic View was active
Display all QSOs for selected cell: displays all QSOs that belong to the Statistic Entry key represented by the cell. Double clicking on the cell displays only the QSOs corresponding to the Status shown in the cell. Example: if you want to see all the QSOs that you have confirmed with Germany on 80 m CW, then double-clicking on the cell for DL/80m/CW will show you those QSOs, but NOT the ones that are not confirmed.
Print: print the statistic
Print Totals: print only the total section
Select / Edit Statistic: select another Statistic or another Statistic-Report-Template
Export Details: export the Statistic Details
Export Totals: Export the Statistic Totals
Colors: Select the colors for the Statistic cells
The Statistic-Quick-View displays a small window which contains the Statistic Information for the currently selected QSO, for example the DXCC statistic for that country, WAZ statistic for this zone, etc., on different bands and in different modes.
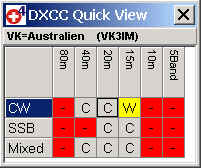
The Quick-Views are opened in the same way as Statistic-Views, but Statistic-Quick-View must be selected from the main menu.
You can display all QSOs that belong to a Statistic Cell by double clicking on it.
The Statistic-Quick-Info window displays the following Information for the currently selected QSO:
The DXCC Information
A summary for selected Statistics
Optionally a list of previous QSOs with the current station.
This window is updated whenever you enter a new QSO. It is also updated when a new QSO in the logbook view is selected or a DX-Message is selected in the DX-Message-Window and the option 'Update Quick Stat. automatically' of the corresponding window is set.
It is a split screen window. Drag the split bar (between table and fields) to readjust the screen parts.
To open the Quick-View either:
Press Ctrl-V.
Press the
button.
Select View | Statistic Quick-Info from main menu.
Use the pop-up menu (right mouse button) to configure the Quick-View
Colors: select the colors for the Statistic cells
Change Layout: select and arrange the fields in the previous QSO grid
Export: export the Statistic-Information
Select Statistic: select the statistics which should be displayed
Statistic-Report-Templates define what and how information is displayed in statistic views.
As with Statistics there are standard and private Statistic-Report-Templates. You can add and change private templates but not standard templates. You add or modify Statistic Report Templates in the Statistic Selection Dialog. That means that you have to open a Statistic View in order to work with Statistic Report Templates. Select
View ¦ Statistic
or
View ¦ Statistic-Quick-View
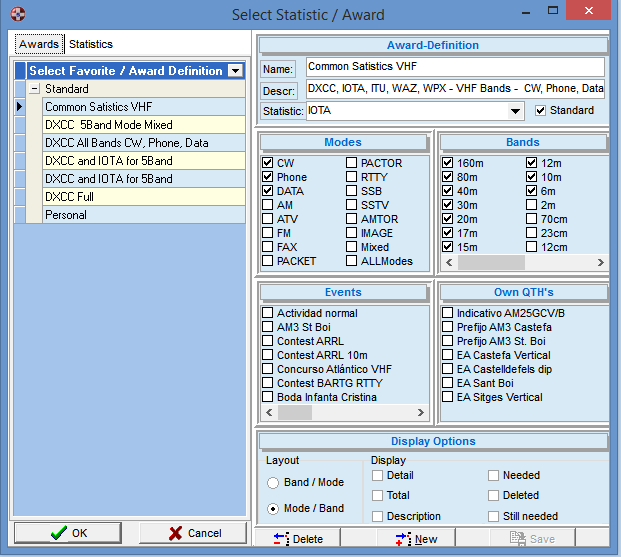
Press New to create a new template.
Enter a name and a description for the template in the fields Name /
Description respectively. IMPORTANT:
for technical reasons, Name can't contain
commas. Therefore, the comma key will be disabled in this field.
Select the Bands and Modes you want to see for this
statistic by putting a checkmark in their box (left-click). Note that
these are Report-Bands
and -Modes. The sequence in which the Bands and Modes are arranged
determines the order in which they will be displayed on the statistic. You
can change the sequence by selecting an entry and moving it up or down
with the corresponding arrows.
Select the QTHs with the QSOs you want to apply for the Statistics.
If no QTH is selected all QSOs will count for the Statistic.
Select what sections should be displayed:
Detail: display the detail section, that means for each
possible Statistic-Entry one line
Total: display the total counters
Description: display a detailed description like the DXCC-Country-name
for each Statistic-Entry. The detail information is retrieved from the
Information-Table associated with the Statistic.
Needed: display also 'needed' Statistic-Entries. An
Information-Table must be associated with the Statistic for this Option.
Deleted: also display 'deleted' Statistic-Entries
still needed: Display only the Statistic-Entries which are still
needed
Select the Layout. The Statistic can be ordered by Band first, then Mode (Band / Mode), or by Mode first, then Band (Mode /Band).
Now press Save to save the new template.
Copyright © 2004 SWISSLOG
Last modified:
25 oct. 2020