World Map in SWISSLOG
Features:
- 7 different projections including spherical projection
- show DX stations, spotters, and path on the map including the predicted signal strength
- Enable/disable CAT link by means of a button
- show DXCC - QSL status on the map
- show Grid-Square - status on the map
- detailed geographical details down to the counties and highways
- displays your and your partners QTH and signal path automatically when you enter a QSO
- displays your and your partners QTH and signal path for any QSO in the Logbook
- displays Gray-Line
- display coordinates, QTH-Locator and country when the mouse is moved over it
- calculate the propagation prediction for a point clicked on the map
- turn the antenna to a point double clicked on the map (only if rotor interface is started)
- show only DXCC/Grids for QSOs made by satellite
To Open the world map:
- Press the button

or
- Select VIEW ¦ WORLD MAP from main menu.
IMPORTANT: The World Map supports a texture mapped surface. By default, Swisslog uses a high quality texture (see World Map Textures). The screenshots below shown the world map function without using this texture. If you prefer to display the world map this way do the following:
- Press Configuration button
- Press TextureMap button. In the next dialog box press Cancel
- Now select the TGWorld_high.LYR layer and check the Show Layer option below

While you move the mouse longitude, latitude, QTH-Locator, name of the area and the layer-name are displayed for the point where the mouse is located.
Zoom the Map
The map can be zoomed with the three zoom-buttons and the mouse.
Buttons:
Zoom out
Zoom to World. Fits the whole world in the window
Mouse:
With the right mouse button pressed mark the area you want to enlarge. Use mouse wheel to zoom in / zoom out.
Move the Map
The map can be moved using the mouse and the scroll bars. To move the map with the mouse keep the left mouse button pressed and move into the direction you want to move the map. This also allows you to turn the globe in spherical projection.
CAT link
The map can be linked to the transceiver control to automatically set the band from the transceiver to display DXCC / Grids Square QSL status on the map for the current band:
Map is not linked to transceiver control (default option)
Map is linked with the transceiver control
IMPORTANT: When enabling CAT link, you may experience some delay before reading the current band from the transceiver and displaying the DXCC / Grid Square status on the map. This is a normal behaviour and it depends on the number of QSO in your logbook and the features of your computer.
Show Satellite QSOs
The map can display DXCC / Grids Square QSL status only for satellite QSOs:
Press to display only satellite QSOs (default option).
Press to display all QSOs.
Display current QSO on the Map
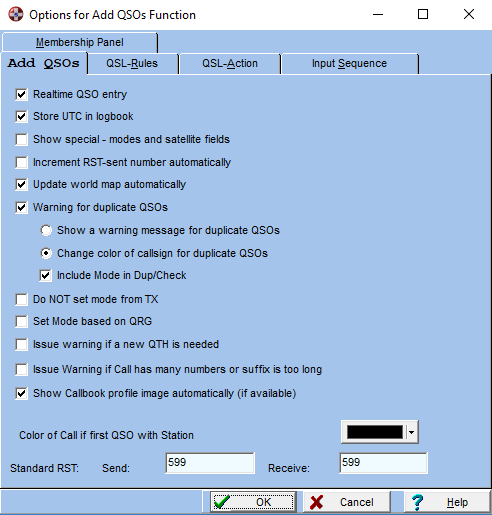
You can either display the current QSO automatically or on request. To automatically display the QSO set the corresponding option in the Edit-QSO Option Dialog. To display the QSO on request reset that option and press the Map button when you want to display the QSO.
To set the Option proceed as follows
- Open the Edit-QSO Window and activate it
- Select Options.. from the main menu or press the right mouse button
- Select or deselect the option Update world map automatically in the following dialog
Display a QSO from the Logbook
Open a logbook view, select the QSO you want to display and press the Map button
Display DXCC-QSL status
You can display the DXCC-QSL status on the Map. The "Confirmed" status means that it's confirmed either by QSL card, eQSL or LoTW. The DXCC abbreviation is displayed on the map in the color corresponding to your QSL-status. You can define the colors to be used with the Configuration function (see Configuration)
The DXCC-QSL status can be displayed per band/mode or for all QSO. Select the band to be displayed from the drop down list DXCCs (or enable CAT link to read band automatically from your transceiver).
Select the mode to be displayed from the drop down list Modes. This list includes the following report modes which groups some modes (they are defined in Edit | Add / Edit modes > Report Modes):
PHONE: AM, FM, DIGITALVOICE and SSB.
MIXED: AM, FM, CW and SSB.
DATA: all digital modes
IMAGE: ATV, FAX and SSTV
To hide the DXCC information go to the configuration and de-select show Layer of the layer named DXCC

The DXCC information is only displayed at a certain zoom level
Display Grid-Square - QSL Status
Similar to the DXCC-QSL status you can display the Grid-Square-QSL status on the Map. The "Confirmed" status means that it's confirmed either by QSL card, eQSL or LoTW. The Grid-Squares are shaded in the color corresponding to your QSL status. You can define the colors to be used with the Configuration function (see Configuration)
In addition you can display the Grid Square Grid on the map. Press the button
to show/hide the Grid.
The Grid-Square-QSL status can be displayed per band/mode or for all QSOs. Select the band to be displayed from the drop down list Grid Squares (or enable CAT link to read band from your transceiver).
Select the mode to be displayed from the drop down list Modes. This list includes the following report modes which groups some modes (they are defined in Edit | Add / Edit modes > Report Modes):
PHONE: AM, FM, DIGITALVOICE and SSB.
MIXED: AM, FM, CW and SSB.
DATA: all digital modes
IMAGE: ATV, FAX and SSTV
To hide the Grid-Square information select none in the drop down list or go to the configuration and de-select show Layer for the layer named Grid Square

The Grid Square information is only displayed at a certain zoom level
Calculate Propagation Prediction for a Point on the Map
If you press the left mouse button on the map the propagation prediction is calculated and displayed for the selected location in the propagation prediction window. This function must be enabled in the menu. Select/de-select Update Propagation-Prediction either in the main menu Map.. or in the pop-up menu.
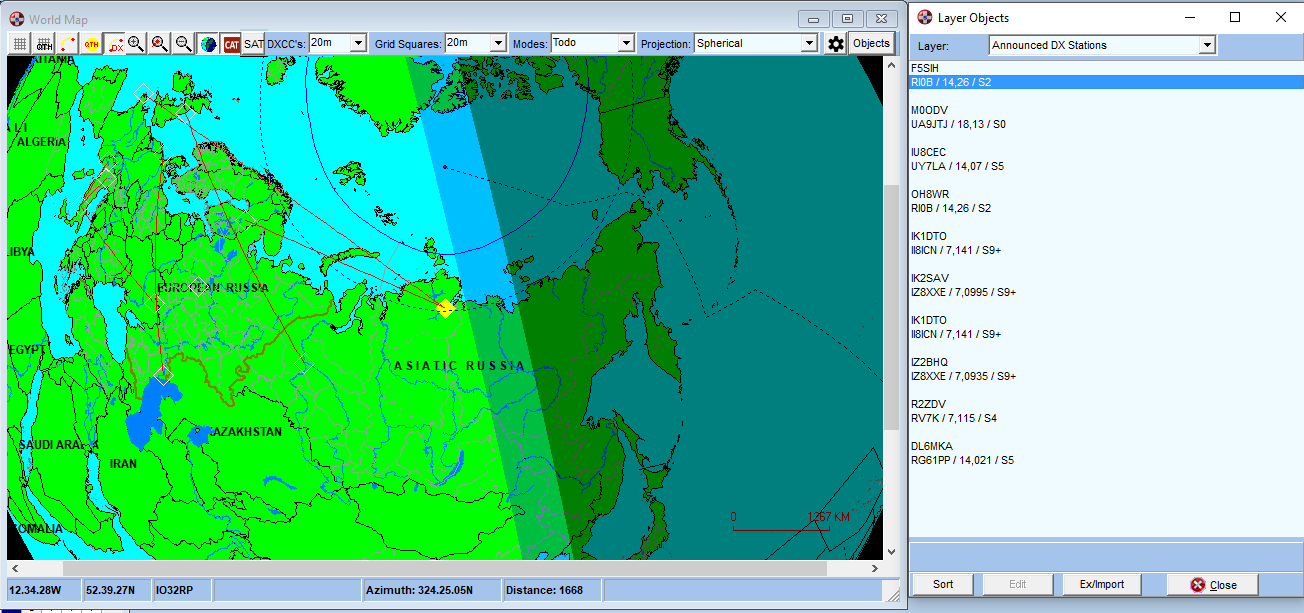
Display DX Spots on the Map
The announced DX-Spots can be displayed on the Map. For each station plotted on the map the propagation prediction for your QTH is calculated. The color which is used to plot the station indicates the signal strength; darker means better signal strength. The information is also displayed at the bottom of the map on the status bar; just move the mouse cursor to the station.
You have to configure if, how and which DX spots should be automatically displayed. Please see Configuring the Map.
You can also plot spots from the DX-Cluster Window. Select a spot and press the Map button. The selected spot and all following will be displayed on the map. Note, that only the number of spots configured will be displayed.

Locate Objects on the Map
As already explained, everything displayed on the Map are Objects. So Countries, Cities, DXCC Areas, DX-Spots, Rivers and so an are all objects. The Object-View lists all Objects stored in a Layer and enables you to center the selected object on the Map. So if you don't know where a certain DXCC area is located
open the Object View,
select the DXCC Layer in the drop down list at the top
and click on the DXCC area you are interested in the list
The selected DXCC area is then centered on the map.
This is possible for all layers. The example below shows the objects on the layer with the DX-Spots. You see that Call, QRG and the estimated signal strength are displayed for the DX station.
 .
.
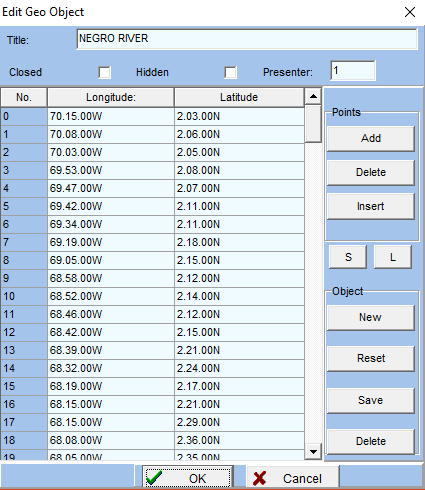
Edit the Geo-Object
You can Edit the Geo-Object by pressing the Edit Button. For Point-Objects you can change the Title and the geographical location, for polygons and lines only the tile. You must save the layer if you want to make the changes persistent.
Configuration of the World Map
The Map can be configured in many ways ! Don't panic, I have configured the map in such a way, that it can be used without modification. But I know that some of you like to play around and experiment. Just do it, maybe you find other nice configuration settings. If this is the case then send it to me so we can share it with other users.
There are two levels of configurations. The first is performed on the World Map Configuration dialog; the second, I call it fine tuning, is performed on layer level by selecting a layer and pressing the Properties button.
Configuration
To configure the map press the Configuration button
. This displays the World Map Configuration Dialog.

Save / Load Configurations
The map configuration can be saved in 'Environment' Files. Use the Load Env / Save Env buttons to save and load environment files. The active configuration of the map is saved into the currently active environment file when the map is closed.
Map Center
You can specify the location which should be in the center of the map when the Zoom to World button is pressed
Options
Show Scale displays a scale in the right lower corner of the map.
Transparent makes the world transparent so that you see the countries at the opposite side of the world in a different color.
Update Prop. Predictions calculates the Propagation Prediction for the location on which you pressed the mouse button and updates the propagation prediction window.
Colors
Surface color of the earth surface
Background color of background on which the map is drawn
Night color used to calculate the color for the area which is in the dark
Grey Line color used to calculate the color for the area which is in the twilight
Needed color used to draw DXCC abbreviations of DXCCs you still need
Worked color used to draw DXCC abbreviations of DXCCs you worked
Confirmed color used to draw DXCC abbreviations of DXCCs which are confirmed
DX-Stations Options
These entries allow you to configure which DX-Spots will be displayed on the map. To display DX-Spots you must have a DX-Cluster/Band Map window active.
Show DX Stations on Map: check this if you want the DX-Spots automatically displayed on the map. Note: if you select a DX-Spot in the DX-Cluster-Window the DX-Spots are always displayed. But the selection rules are applied.
Min. Distance specifies the minimum distance between your QTH and the DX stations which should be displayed
Nr. of Stations specifies the maximum number of DX-stations concurrently shown on the map. If this number is reached, the oldest DX-station is removed
Show Signal path specifies if the signal-path between the announcing- and the DX-station should be drawn
Show announcing Station specifies, that the announcing station should be displayed. If the announcing station is not displayed, the signal path is not displayed either
Working with Layers
The World Map displays the geographical data specified in longitude and latitude coordinates projected onto the surface of the earth. This data is in the form of Geo-Objects which contain points, polylines or polygons. A set of Geo-Objects is called a Layer and can represent the world, a geographical area, lakes, rivers and so on. Depending on what you want to see you load, delete or hide Layers. The properties of the Objects displayed on a layer can be specified. This allows you to define the color, the zoom level that the layer is displayed and much more. In this chapter you learn some more about the layers and what you can do with them.
Each layer contains a set of Geo-Objects which are loaded into the World map from external files, the Mapfiles. Currently industry standard data files are MapInfo (.MIF) and ESRI (.SHP) files as well as the world map internal format .LYR files are supported.
SWISSLOG uses some layers to display log information. These layers are not stored in mapfiles.
A large number of Mapfiles in the internal .LYR format are distributed with SWISSLOG.
Loading, Arranging and Deleting Layers
Layers are manipulated in the World map Configuration Dialog. The loaded Layers are listed on the left of the Dialog Window.
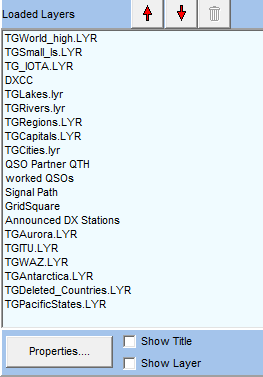
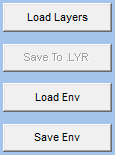
Load Layers
To Load Layers press the Load Layer Button. In the open dialog several map files can be selected at the same time.
Arrange Layers
The two arrow buttons at the top of the layer list are used to arrange the layers. The sequence of the layers in the layer lists defines the sequence the layer are painted. So the second layer is painted on the top of the first layer, the third on the top of the second and first layer.. Therefore the position of a layer may be important because a layer may be hidden by another one if the sequence is incorrect. Note that you can not manipulate the SWISSLOG layers.
Delete Layers
To Delete a Layer select the layer and press the trashcan button at the top of the layer list.
Modifying the Properties of a Layer
To modify the properties of a layer select it in the layer list. The most important properties, Show Layer and Show Title, can be selected directly with the checkboxes at the bottom of the layer list.
- Show Tile displays/hides the titles of the objects
- Show Layer displays/hides the complete layer without deleting it
To modify other properties press the Properties button. This displays the following dialog:

On the lower part you see the details of the selected layer. If a layer contains only a small area of the globe, you have to 'search' for the objects by using the scrollbars and the zoom buttons. You can verify the properties setting here.
At the top you see the Globe wide Parameters. These Parameters act on all Layers and control the minimum and maximum Text Height for the titles.
In the middle part you find Tabs which contain the controls to define the individual properties. The number of tabs varies depending on the type of objects contained in the layer.
Appearance
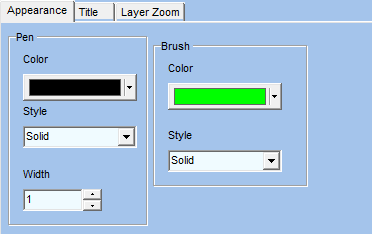
Appearance controls how the objects are drawn on the map.
Pen controls how the border is drawn:
- Color is the color of the border
- Style defines the kind of borderline (solid, dash, dot,....)
- Width defines the width of the borderline
Brush defines how the object is filled
- Color is the color used to fill the object
- Style defines the fill pattern used to fill the object (solid, horizontal, vertical, cross,...)
Title

Title controls how the title of the objects is drawn.
Font defines the font to be used. This is self-explanatory and needs no further explanations.
Unit controls at what size the object appears on the map. Objects are hidden until their size reaches the one defined in units. This property is a bit tricky to use and you have to experiment with it to find the correct setting. The unit parameter can be defined in KM, Miles, Meter, inch and so on as well as in special units S1 to S8. I prefer to work with the special units because they give better control..
Alignment controls the location of the title (play around to see how it works)
Hide hides the title (can also be set on the configuration Dialog)
Position is controlled by selecting one of the 9 radio buttons
Offset specifies the offset from the position selected
Layer Zoom

Layer Zoom controls at what zoom level the layer is displayed. This allows you to control at what zoom level a layer should be drawn on the map. For example you can define that the details of Switzerland are only displayed when the observer altitude is 650m. I know, that from 650m altitude you would not see much of Switzerland, but for the map in SWISSLOG it is just OK. Also here you need to experiment a bit.
Minimum defines the minimum Zoom Level in Units at which the layer is displayed
Maximum defines the maximum Zoom Level in Units until which the layer is displayed
Units defines the Zoom Units in which Minimum and Maximum are defined
Style

Style defines how point objects are displayed. Point objects are geographical objects defined by one point, like a city or a QSO Partner.
Type defines the shape of the point. If you select FontSymbol, you can customize it in the tab Symbol
Sizes controls the size of the point and at which zoom level the point is displayed
Point Size is the size of the point. It is used to calculate the actual size based on the zoom level
Point Unit is the same as Unit we had before. It controls at what zoom level the point is displayed
Maximum Size limits the size of the point on the map
World map textures
The World Map also supports a texture mapped surface. The surface of the globe can be overlaid with a bitmap image. The image is rendered very quickly as it is loaded into memory. The size of the image can effect performance when it gets large enough to exceed available memory and the operating system starts to swap. This should not be a problem with current computers. If you have a very old computer and you experience performance issues with the default texture, do the following:
- Press Configuration button
- Press TextureMap button. In the next dialog box press Cancel
- Now select the TGWorld_high.LYR layer and check the Show Layer option below
This is how the world map function looks like with the default high quality texture (created by Tom Patterson, www.shadedrelief.com):

The world map function only supports 256 colours bitmaps (8 bits). If you want to use other textures you will have to convert it to match this requirements.
When you use a texture mapped surface it is important that you set the Brush Style of the Appearance to clear for all layers containing landscapes.