Pivot Tables
What are Pivot Tables? This is certainly one of the most frequently asked
questions. Pivot Tables are summary reports which can be grouped by different
criteria, which allows calculation of various values based on these groups.
Pivot Tables are also referred to as inverted grids. To learn more about pivot
tables, please refer to the documentation for Excel or other spreadsheet
programs. In this case, perhaps the best description is a picture.... Note,
the image below is based on a DXCC statistic whereas, the example used in the
tutorial creates a Pivot Table based on a DOK statistic.
Click here for a separate tutorial that creates a DXCC Pivot Table.
Before you create a Pivot Table you should decide what information you would
like to display. A Pivot Table consists of the following fields:
- Group fields – which define how the QSO's are grouped. The sequence of
the fields defines how they will be sorted.
- Evaluation field – defines which columns will be displayed.
- Calculation field – is used to calculate the values displayed in the
cross point-cells of the group-lines and the evaluation-columns.
- Summary fields – are used to display values for the entire group.
Create a Pivot Table
The creation of the Pivot Table is explained by using an example based on the
DOK statistic. The Pivot Table will be created in two steps: First, the table
will be created showing the following entries:
- DOK
- Number of QSO's
- Number of confirmed QSO's
- 10m thru 40m bands, and 80m band, including the first call sign per band
The second step, will be extended in such a way that it also shows:
- The modes CW, FM and SSB
- Also, the bands 2m and 70cm are added
When you understand the entire process you will be able to create your own
Pivot Table for WAE, WAZ, DOK and others.
This example assumes that you have the DOK statistic in your database. If not,
you can import the statistic – from the main menu click on File ¦
Statistic Import / Export ¦ Import Statistic and select the appropriate
statistic from the list, or click on Statistic Import/Export for more detailed information.
To create a Pivot Table click on Wizards ¦
Create Pivot-Table.
The dialog window Selection of the Group-Fields is
displayed as shown below:
- Near the bottom of the window, click on the arrow at the right of the
field Statistic as template: A list of the available statistics will appear,
select DOK.
- In the window Group-Fields the value SUB_REGION appears. This is the field where the DOK has been
stored.
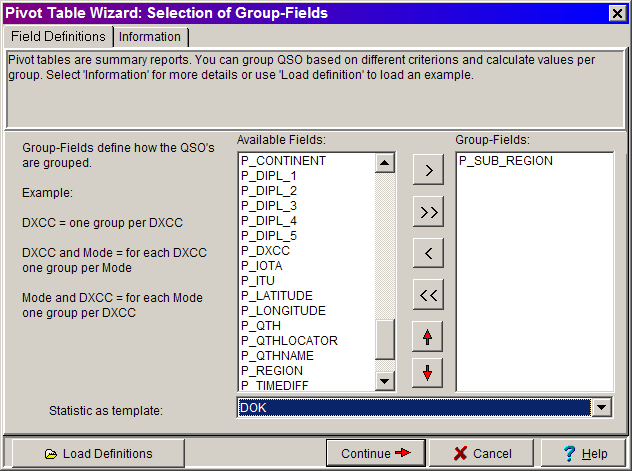
- Press the Continue button.
- The dialog window Select Evaluation-Field is
displayed next:
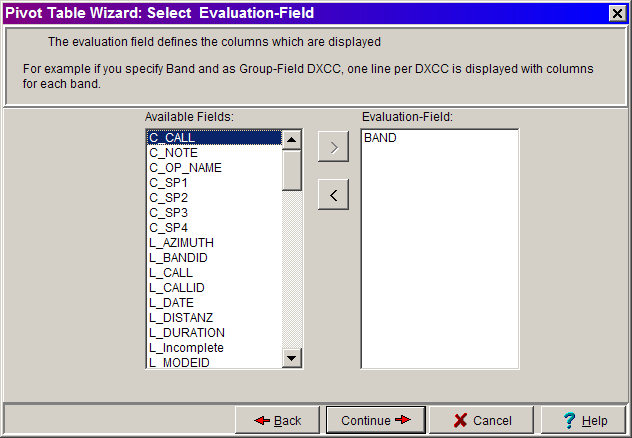
- Since we want an evaluation per Band, select
Band in the list of Available Fields and press the > button
to move the field into the Evaluation-Field list.
- Press the Continue button.
- The dialog window Select Calculation-Field is displayed next:
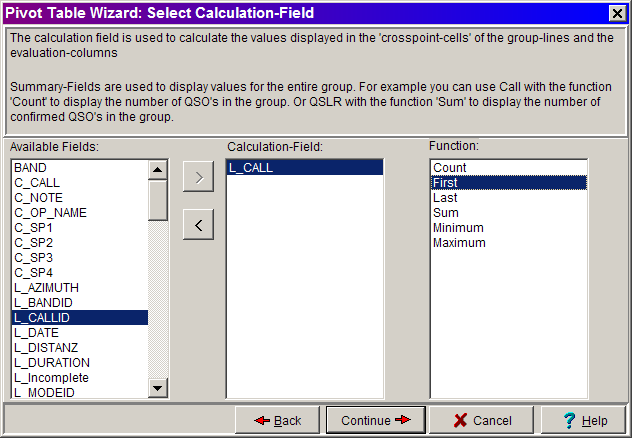
- In this step, you define which field is used for the values displayed at
the cross points and how these values should be calculated. In our DOK
example we would like to display the call sign of the first station worked
on each of the selected bands.
- Therefore we select L_CALL from the
list of Available Fields and press the > button.
- From the function list we select First because we want to see
the first QSO for each group.
- Press the Continue button.
- The dialog window Select Summary-Fields is
displayed next:

- You can display values which are aggregated within the group of QSO's that
are presented by row. The available (aggregate) functions are shown in the
function list. First and last are not real aggregates – however, they
allow you to display values of fields for the first or last QSO in a group.
- Select C_Call and select the function Count – this will
show the number of QSO's represented by the row.
- Select L_QSL_Received and the function Sum – this will
show the number of confirmed QSO's represented by the row.
- We also want the first call sign confirmed to be displayed in the table.
Therefore, select L_Call and the function First
- Press the Continue button.
- The dialog window Select and display QSO's is
displayed next:
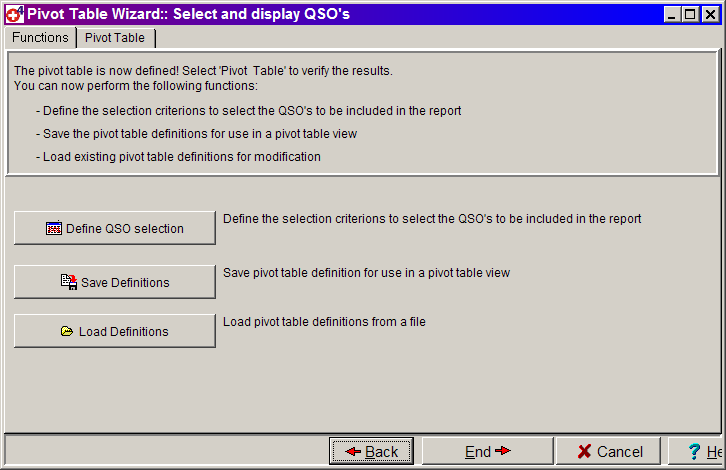
The dialog window Select and display QSO's contains of two pages, the Functions
page and the Pivot Table page. The functions page allows you to select
the following Functions:
- Define QSO Selection – this allows you to define the selection
criteria for the QSO's you want to display.
- Save Definitions – allows you to save the definitions you
have created for later use.
- Load Definitions – allows you to reload definitions that were
previously saved.
- Press Define QSO Selection button.
- The second part of the Select and display QSO's dialog window is displayed next. The appearance of
this window is dependent on information you have entered in Swisslog; such
as your Own QTH, QSL-Action, etc.
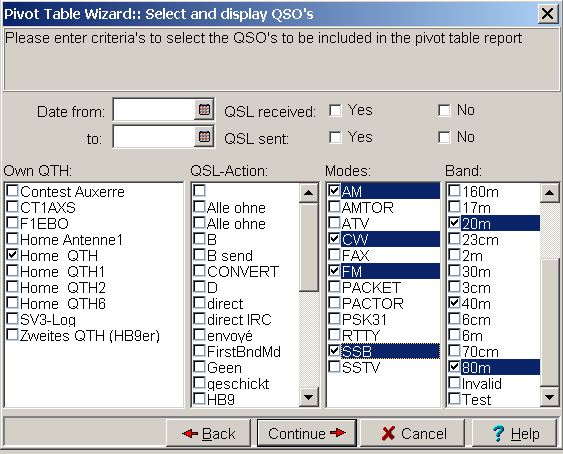
- Enter the selection criteria by checking the appropriate boxes. For
example check; AM, CW, FM, SSB in the Modes column, and check 10m, 15m, 20m,
40m, and 80m in the Band column.
- Press the Continue button, this will bring you back to the first
part of the Select and display QSO's dialog
window.
- Now we are ready to display the results – click on the Pivot Table Tab and wait a few moments until the table is
displayed.
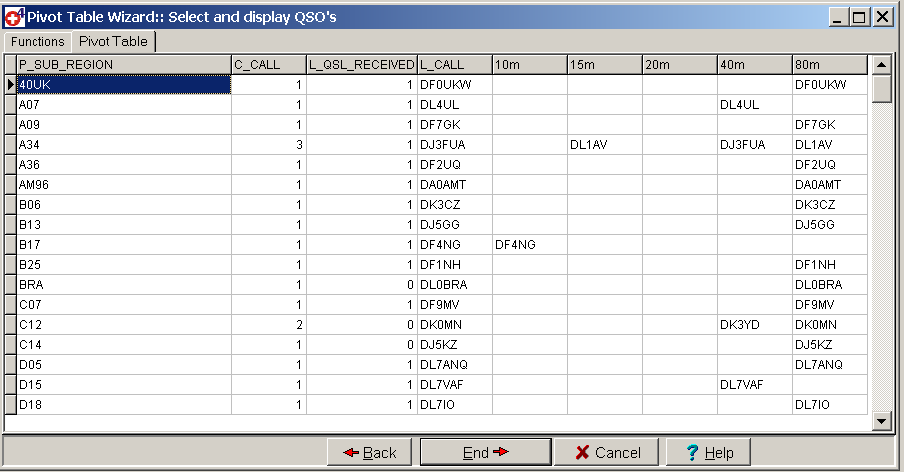
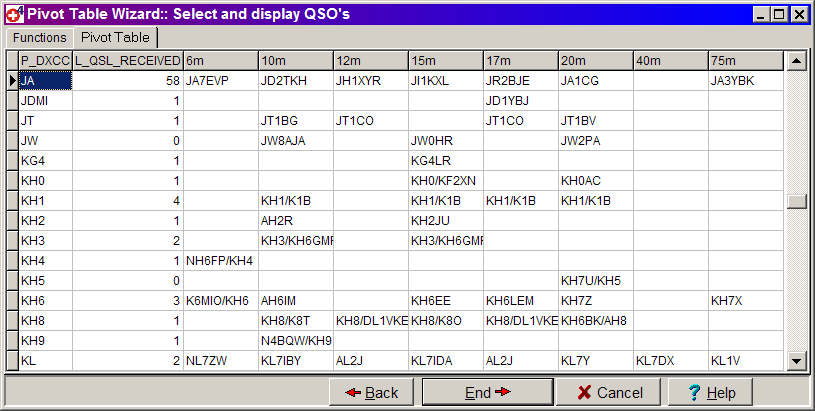
The image above shows the results of a Pivot Table based on the DOK statistic
– the data is explained as follows:
P_Sub_Region – shows the DOK.
C_Call – lists the total number of QSO's which exist for this DOK.
L_QSL_Received – lists the number of QSL Cards which have been
received from the DOK.
L_Call – displays the Callsign of the first QSO in the group of QSO's
with the DOK.
10m, 20m, etc... – displays the Callsign of the first QSO on the
applicable band with the DOK.
Copyright © 2004 SWISSLOG
Last modified: 01 Jan 2005