Band Map
Swisslog implements a very complete Band map function with the following features:
-
Wide zoom in/out range
-
Custom font size for DX-Spots
-
Band filtering (including 60m)
-
Resizable window
-
Full spot details (including if LotW/eQSL user) when placing mouse cursor over a DX spot
-
Dupe control for band or band/mode (user selectable) displaying (D) if dupe. You can also hide all band/mode dupes!
-
Customizable statistic selection! DXCC is the default statistic but user can select any available statistic
-
Enable/disable CAT link by means of a button
-
Gradient colors for frequency ruler
-
Colors customization: background, ruler gradients, ruler measures, frequency and even buttons!
-
You can have as many band maps as you want with different band filters, colors, statistics, font and window size, etc.
-
Even you can place every band map as standalone window for dual monitor systems!
-
You can also send DX spots to your SDR Panorama if using TCI (ExpertSDR) or Flex Radio as transceiver control.
The Band Map window
DX-Messages can be displayed in the Band Map windows (or in the classic Dx messages windows). However the Band Map window offers a graphical view of the whole band activity which is very interesting and nice looking! You can open as many band maps as you want! Each window can display different bands, statistic and use a different set of filters, settings, etc.
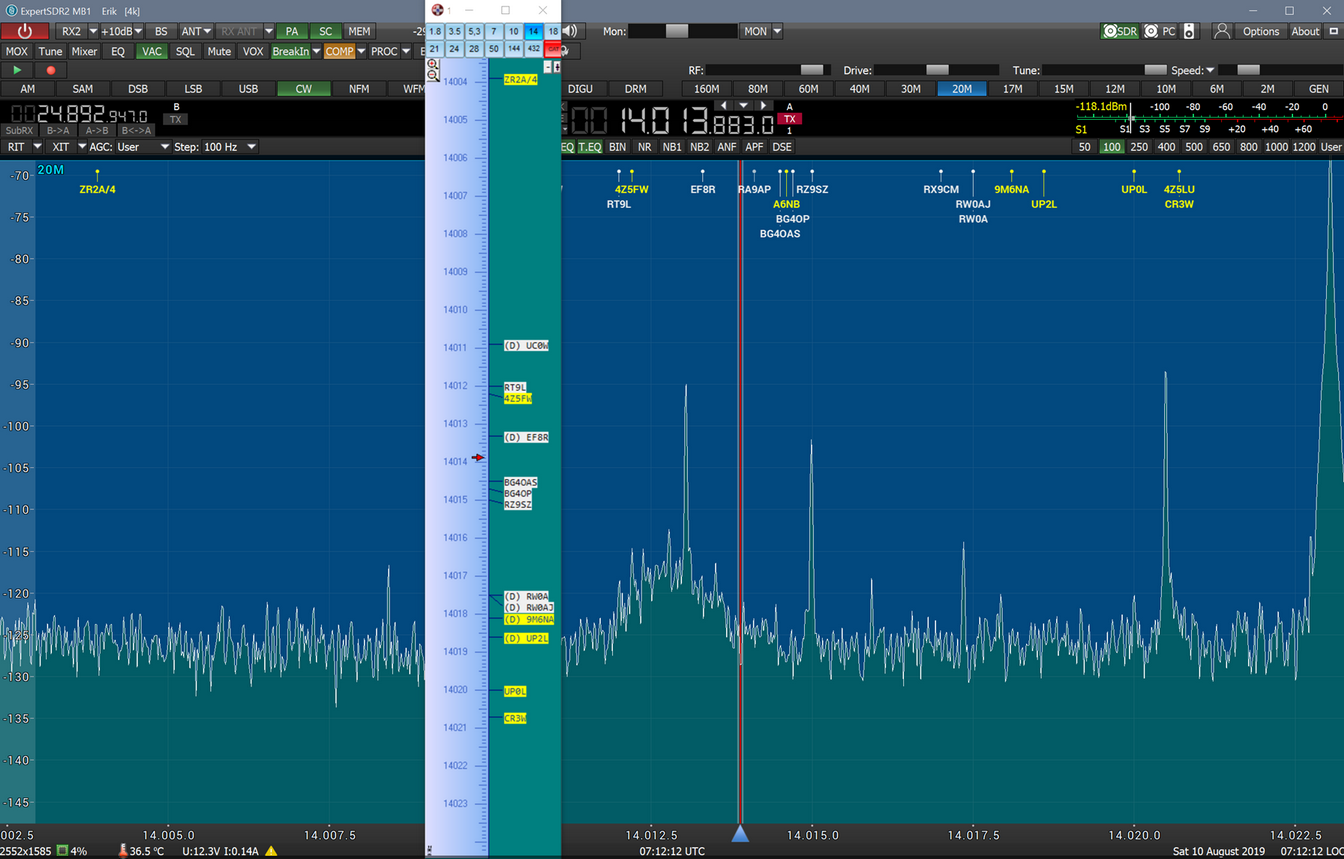
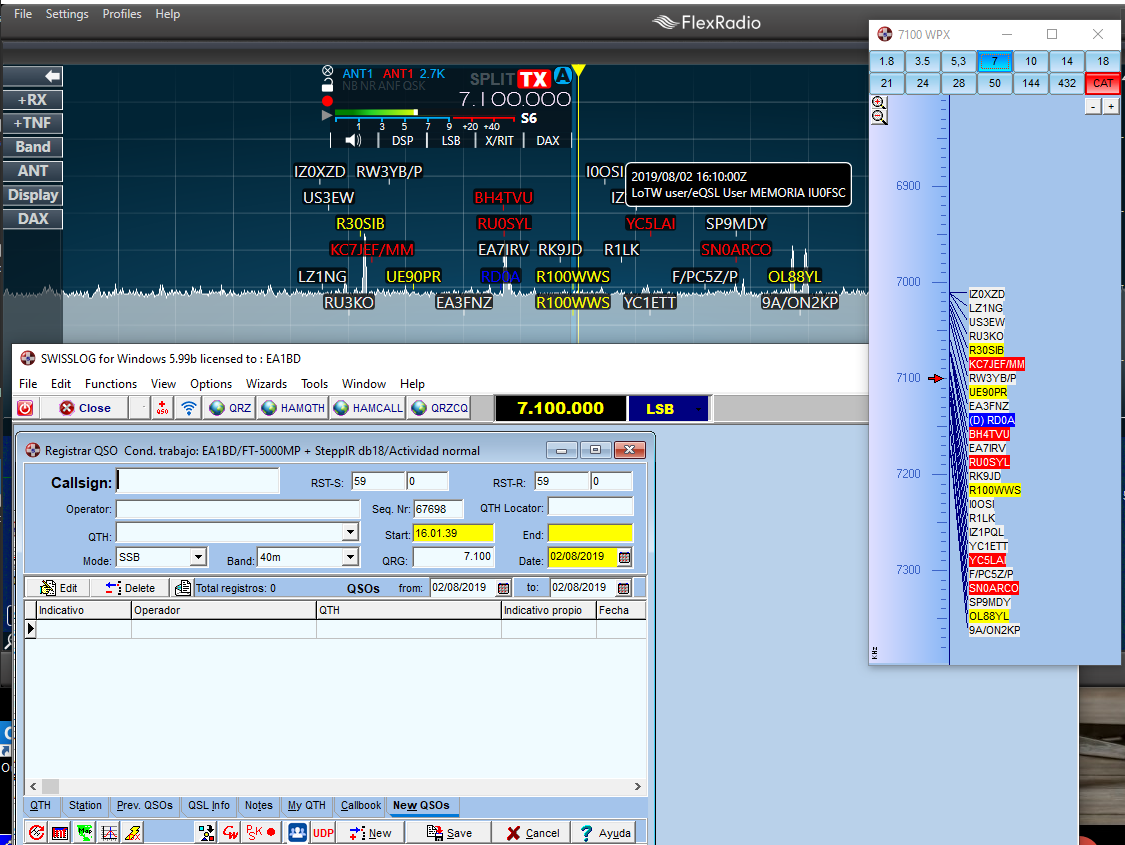
To open a Band Map window: Select View | Band Map. This is what the window looks like:
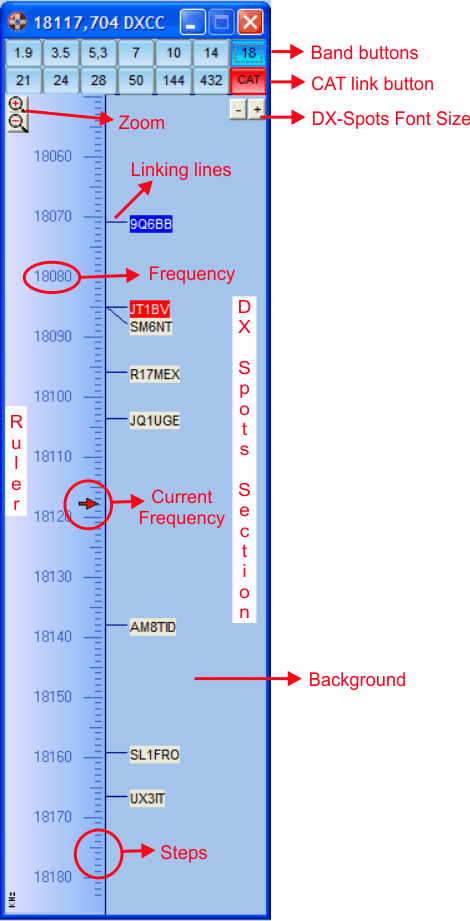
Use the zoom buttons to enlarge/narrow the bandwidth by pressing the correspondig + or - buttons respectively (or by using the mouse wheel). You can also move the dial up/down by dragging the ruler with your mouse (left click, hold and drag up/down). You can resize the band map window to the size you need.
Use the + - buttons located below the CAT button to change the font size of Dx Spots.
Use the band buttons to select the desired band and use the CAT button to enable/disable link to the transceiver (if the transceiver control is started).
Hint: Disabling the CAT link is very useful if you want to have several Band Maps window open in different bands. For example: you can have one band map linked to CAT to follow the transceiver band and other fixed band maps according to your needs. If CAT is enabled and transceiver control is started when user press any band button the transceiver will be tuned to the selected band.
By placing the mouse cursor over any DX Spot you will see the spot details (including if LotW/eQSL user or US State for US Calls if found in the embedded FCC database):
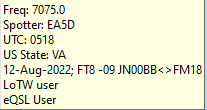
IMPORTANT: Searching US State in the FCC database may affect performance according your computer, number of QSO in your logbook, spot traffic and parallel software being executed along with Swisslog. If you experience this o simply don't want to use this feature, it can be disabled in Options / Query US State to the FCC database for DX message and Band Maps windows.
Swisslog is also able to identify the references of the following awards if found in the spot comments:
-
Spanish awards: DCE, DEE, DEFE, DME, DMVE and DVGE.
-
International awards: IOTA, SOTA, RDA, WCA and WFF.
By default, Swisslog reads automatically the POTA reference by checking every minute the POTA web site to know current activators. If you don't want to use this feature or you don't follow POTA award, it can be disabled in Options / Query POTA activators.
These powerful features allow the following:
-
Add these statistics to know the statistic status in realtime the same way already works for others awards such as DXCC, WAS, WAZ, WPX, etc.
-
If user logs the QSO from the DX message (spot), all recognised references will be automatically set to the corresponding fields.
-
The use of Statistic Quick Views for these statistics. Clicking on a spot will give you realtime information of the reference for the selected bands/modes, as well as the full reference name, if found in the associated info table.
IMPORTANT: most spotters tend to write these awards references in a different format as the reference was officially defined in the award. Example for WFF: EAFF0001 instead of EAFF-0001 or delimiting the reference by dots, commas, slahes instead of using blanks, etc. I have implemented a complex algorithm which searches for the different "wrong" patterns usually found in cluster. Although the accuracy is very high (100% if the reference is written as it is or more than 90% in other cases), there will be cases where is not possible to identify the reference. If not tagged with the award name before, it's practically imposible to know which award is. If you find a spot having any of the supported references and it's not recognised by Swisslog, please send an e-mail to support@swisslogforwindows.com including a screenshot or full details of the specific spot (DX Call, spotter, band and full comments) to try to improve the algorithm (if possible).
If transceiver control is enabled and by double clicking on any frequency of the ruler, the transceiver will be tuned to the selected frequency. At the left bottom part of Swisslog you will see the frequency corresponding to the mouse cursor position.
Options
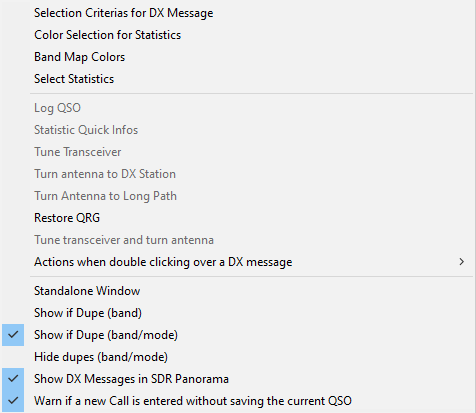
The following options and functions are available via the pop-up menu (right mouse button):
-
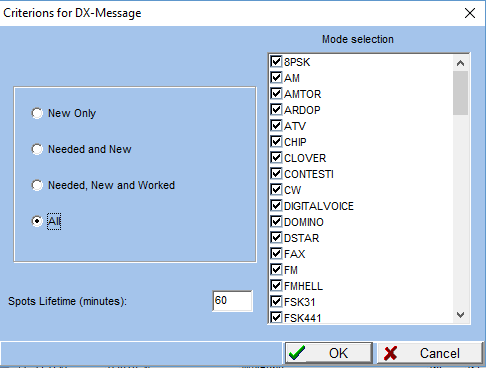
Selection criterias for DX-Message: Mark the modes for which DX-Spots should be displayed and select which Spots you want to see (New, needed, worked, all). You can also set the Spots Lifetime in minutes (default value:60 minutes). Only spots within the defined period of time will be displayed:
-
Color Selection for Statistics: allows you to select the color you want to see every DX Spot according to its status (Confirmed, Worked, Need, New or Not Needed):
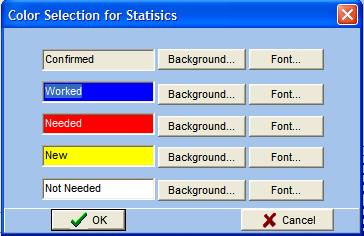
What does NOT NEEDED means? all DX messages not matching with the definitions of the selected statistic. Some examples: for DXCC would be all /MM stations because these stations have no DXCC entity assigned. For WAS would be all DX Messages from entities different than W, KL or KH6.
-
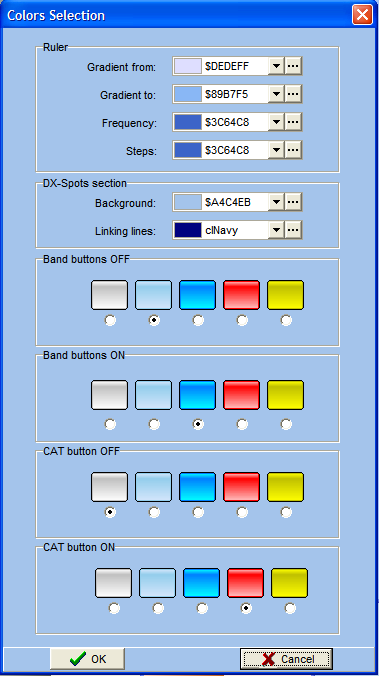
Band Map Colors: allows you to change the color of most parts of the band map. You can create very nice looking band maps according to the user preferences:
-
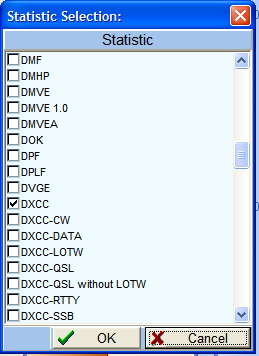
Select Statistics: allows you to select the statistic from which you want to see the status for every DX spot. Select only one statistic!
Hint: The selected statistic will be displayed in the Band Map window title. If you need to see another statistic for the same band, simply open a new Band Map window and select the desired statistic.
-
Log QSO: mouse right click over a DX-Spot and select this option to enter the callsign in the Add QSO window.
-
Statistic-Quick-Infos: mouse right click over a DX-Spot and select this option to display the Statistic-Quick Info window for the selected DX spot.
Hint: If the Statistic-Quick Info window is open, mouse left click on a spot to display the Info for the selected DX spot.
-
Tune transceiver, Turn antenna to DX station, Turn antenna to Long path and Tune and turn antenna: mouse right click over a DX-Spot and select one of these options according to your needs.
-
Restore QRG: Set the previous QRG to the transceiver.
-
Actions when double clicking over a DX message: you can select which actions will be performed when double clicking over a DX message. The following options are available:
-
Tune transceiver and turn antenna (default option)
-
Tune transceiver and Log QSO
-
Tune transceiver, Turn antenna and Log QSO
-
Log QSO
-
-
Standalone Window: usually the window can not be moved out of the mainframe of SWISSLOG. if this option is set then the Window can be moved anywhere. This is especially useful for PCs with multiple monitors.
-
Always On Top: This option is displayed and enabled by default only when window is set as standalone. Window will stay on top over all other windows of other programs all the time. Warning: If this option is unchecked, window can be hidden behind the main SWISSLOG window or even placed outside of the visible space. If you place it outside of the visible space (i.e. when you change the screen resolution) you can only bring it back by editing the SWISSLOG.INI file.
-
Show if Dupes: Swisslog can check if a spotted call is dupe. If dupe (D) is added before the callsign. i.e: (D) EA3GCV.
-
Show if Dupe (band): This option is checked by default. Swisslog checks if it's dupe on the same band regardless the mode. You can switch to band/mode checking (see below) or disable dupe checking (both options unchecked).
-
Show if Dupe (band/mode): Swisslog checks if it's dupe on the same band and mode. IMPORTANT: To show correctly statistics info and for a good dupe control, Swisslog is able to read the following modes if found in the DX Mesasage comments: FT4, FT8, HELL, JT65, JT9, MSK144, OLIVIA, PSK31, PSK63, PSK125 and RTTY. SSB, CW and RTTY are calculated according the Swisslog band plan. You can adapt Swisslog band plan to your needs if you work other modes or if you want to specify fixed frequency ranges for certain modes such as JT65, FT8, etc. If a frequency range doesn't exists in Band Plan, Swisslog assumes SSB as default mode. You can switch to band checking (see upper option) or disable dupe checking (both options unchecked).
-
Hide dupes (band/mode): Check this option to not display dupes on the same band and mode.
-
-
Warn if a new Call is entered without saving the current QSO: If you log a QSO from here and a callsign exists in the Add QSO window, a warning message is released prompting user to save changes or not. Uncheck this option if you want to avoid this warning message and replace the callsign without saving.
-
Show DX messages in SDR Panorama: this option is only available if using TCI/Flex Radio for transceiver control. If checked (default option) all displayed DX messages will be sent to the Panorama/Panadapter in your SDR. The font color of every DX message in your SDR will match with the background color selected to identify the statistic status (Confirmed, Worked, Need, New or Not Needed).
-
The spot life time in your SDR will be the same as set in the selected band map.
-
LoTW/eQSL user
-
Duplicate QSO (if the Show if Dupe option is enabled)
-
Spot comments. Including US State in square brackets for US stations if found in the embedded FCC database.
If you use Flex Radio, the following info is sent for every spot:
All settings (window size and position, font size, zoom, statistic, band filter, colors, etc.) will be saved for every band map window.
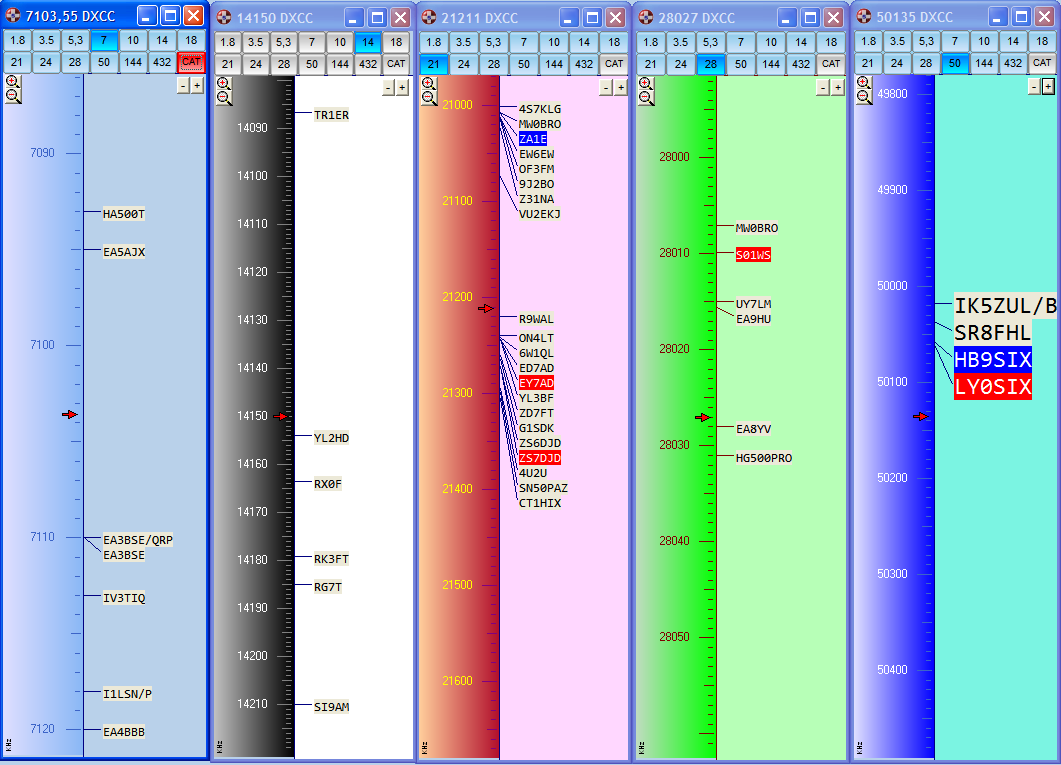
Below you can see some samples of band maps with different settings. There are infinite combinations!
Swisslog implements a band map function to monitor the band activity of WSJT-X / JTDX. Please read the WSJT-X / JTDX Band Map chapter.